With the advances of RF technology over the last many years, most modern spectrum analyzers can now automatically detect changes in phase noise levels (mostly of sine wave signals) measured in units of dBc or rads.
But it’s always a good idea for RF engineers to understand how modern spectrum analyzers measure integrated phase deviation. Or better yet, for them to understand how to optimize a spectrum analyzer’s measurements even further. Believe it or not, but many spectrum analyzer readings of phase noise can be significantly off.
Measuring phase noise deviations is easier than it sounds. All you really have to do is learn how to determine the Root Mean Square (RMS). This is done by calculating the ratio of power from the single-sideband (SSB) phase noise to the carrier.
If you feel unfamiliar with phase noise, check out our Ultimate Guide to Understanding Phase Noise before continuing.
Angle Modulation & the Bessel Function
First, let’s jump back a little and discuss the relationship of the modulating index of an angle modulated signal to the curves of the Bessel function. This will help determine the RMS later on.
Angle Modulation
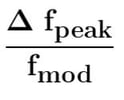
Angle-modulated signals are signals with phase and frequency modulation in a carrier and are identified by a modulation index (m). The easiest way to determine this modulation index is by finding the peak phase deviation. Peak phase deviation is equal to the ratio of the peak frequency deviation to the modulating frequency, and can be found using the formula below:
The Bessel Function
An angle modulating sine wave signal of a given carrier frequency, also at a given modulating frequency, will create an endless number of sidebands. The amplitudes of the modulated carrier and sidebands can be found by looking at the modulation index discussed above, as well as by looking at the curves of the Bessel function J0 - Jn.
Source: mwrf.com
The chart above shows the Bessel function curves (J0-J3). In this example, the black vertical line is at a modulation index of 3 (same as 3 rads). With the intersection of the individual Bessel curves through the mod index, it is easy to see the relative amplitude of the modulated carrier, as well as the sidebands to the unmodulated carrier. It’s important to note this is on a voltage scale.
So, for this example, the relative amplitudes for each individual curve where they cross the mod index (set at 3) are:
- J0 (Modulated carrier) = -0.26
- J1 (1st Sideband) = 0.33
- J2 (2nd Sideband) = 0.48
- J3 (3rd Sideband) = ~0.33
Converting Peak Deviation to RMS
Unfortunately, most spectrum analyzers show the phase noise results in the RMS phase deviation without the peak phase deviation. Here’s a nifty little formula you can use that converts the peak deviation to RMS:
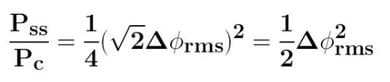
Pss = power of single sideband
Pc = power of carrier
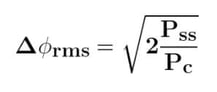
The following equation determines the carrier’s RMS phase deviation when modulated with a sine wave signal (measured on a relative power scale):
Related: The Secret to Low Phase Noise in Crystal Oscillator Circuits
How to Calculate the Integrated Phase Deviation from Phase Noise
To calculate the integrated phase deviation, we must introduce the noise density of the power in the SSB phase noise of a given signal. The integrated bandwidth method will help calculate this phase noise.
First, select a range of offset (interval between fstart to fstop). The power is then integrated between the two frequency points. Do this by using the following formula:
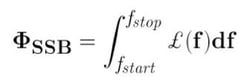
£ (f) = noise density of power in SSB phase noise (power-density ratio units)
To calculate the power of the single-sideband, use:

Use this formula to calculate the entire frequency band (2x as large as single-sideband):

You may notice that the Pss/Pc is the same power as the single-sideband ratio, so:

This calculation is actually used in spectrum analyzers to show the integrated phase noise measurements (in radians).
Phase noise test sets can be quite expensive compared to spectrum analyzers, but can make your phase noise readings much more accurate (and save you the time it takes to do all the calculations).
Related: Phase Noise Measurement: How to Measure Phase Noise with a Crystal Oscillator
Reduce Phase Noise with Bliley
Looking for low phase noise, even in high vibration environments? Browse our full line of high-performance crystal oscillators.